Query API
Most of the rendered data in storefront and Admin is an amalgamation of complex objects, which is many cases are heavily cached to ensure good performance of the platform. In some cases when performing analysis it is required to get access to raw fresh data. Query API specifically targets this problem.
Query API is not only concerned with persistence layer but a multipurpose tool which can be extended via extension point. Out of the box the following API extensions are supported:
| API | Version | Supported Nodes | Purpose | Example |
|---|---|---|---|---|
| SQL:Core | 3.0.0+ | ADM, API, SFx | SQL interface for core RDBMS | select count(*) from TSKUPRICE |
| HQL:Core | 3.0.0+ | ADM, API, SFx | Hibernate QL interface for core RDBMS | select count(s) from SkuPriceEntity s |
| HQL:Payment | 3.0.0+ | ADM | Hibernate QL interface for payment RDBMS | select p from PaymentGatewayParameterEntity p |
| IceCat:Product | 3.3.0+ SaaS | ADM | IceCat search interface to validate product XML | 72514951,72514952 |
| FT:Product | 3.0.0+ | API,SFx | Lucene full text query interface |
brand:toshiba name:w50
|
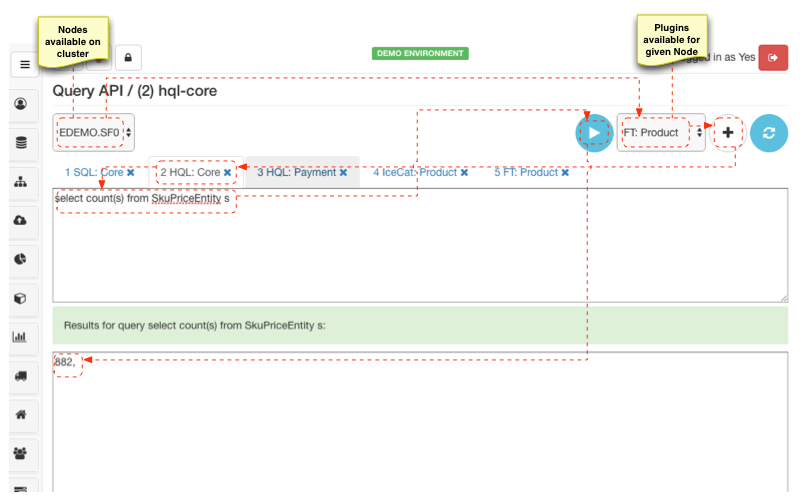
In order to perform a query over desired medium:
- Select Node on which query to be performed
- Select type of API to use and click "Add tab" button
- Enter query in required formal and click "Play" button
Cache monitoring
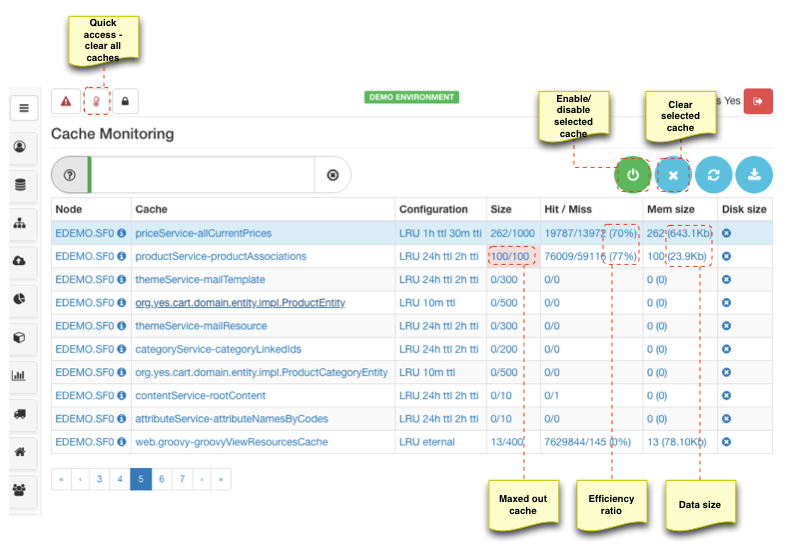
For best performance each application node maintains local cache to reduce contingency on slow resources or speed up results of complex calculations. Cache monitoring panel allows to view all active caches on all nodes in the cluster with corresponding statistics, which include:
- Configuration parameters i.e. caching strategy and expiry timeframes
- Declared size and active size - essential for detecting flooded caches (performance tuning)
- Hit and Miss and efficiency ratio - essential for detecting inefficient caching (performance tuning)
- Memory size - RAM usage indicators (scalability)
All declared caches are active by default. However if is possible to enable/disable individual caches at runtime.
Caches can be cleared all at once, or individually by selecting specific cache and clicking "Evict" button
Performance sensors SaaS
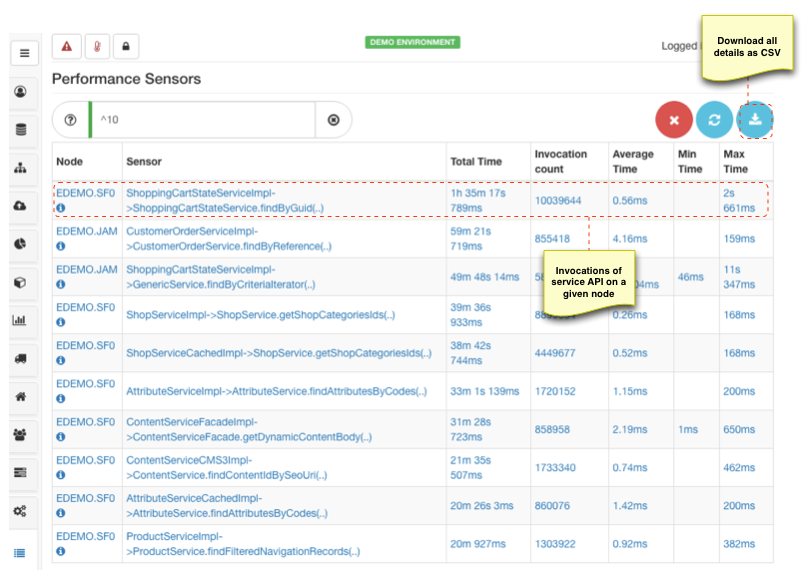
Performance sensors are fine detailed trackers or service layer API invocations.
Each sensor is Node specific and collects information on:
- Total amount of time API is used - to identify execution hot spots
- Invocation count of an API - to identify most used API (possible caching recommendation)
- Average, min and max time - to identify resource contingencies and slow API
Performance samples SaaS
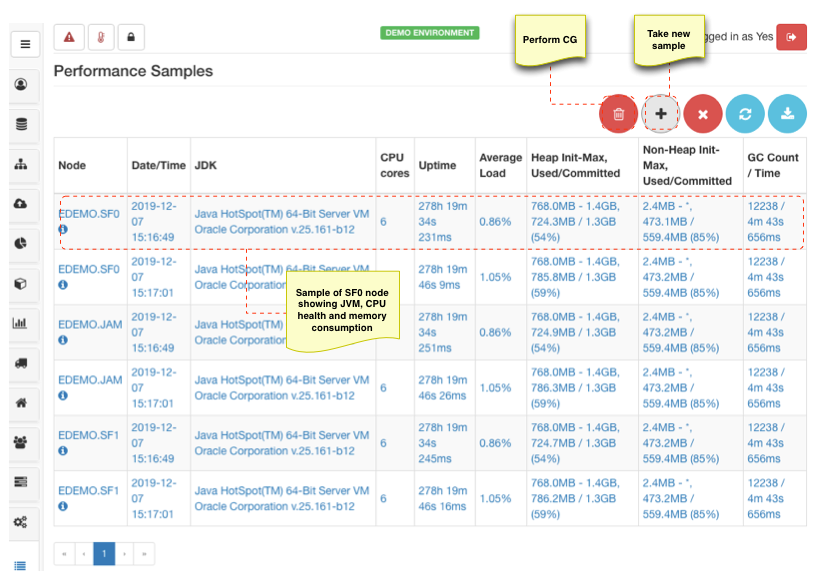
Monitoring CPU and memory consumption in any given application may prove crucial in identifying performance bottleneck and resource restraints.
Sampling nodes in cluster provides essential information about environment of each node: JVM used, CPU cores and load, memory consumption and garbage collector stats. These metrics are invaluable when assessing resources required for the platform or any resource leaks.
Performance samples can also be downloaded as CSV extract for future reference.
Tasks SaaS
YCE
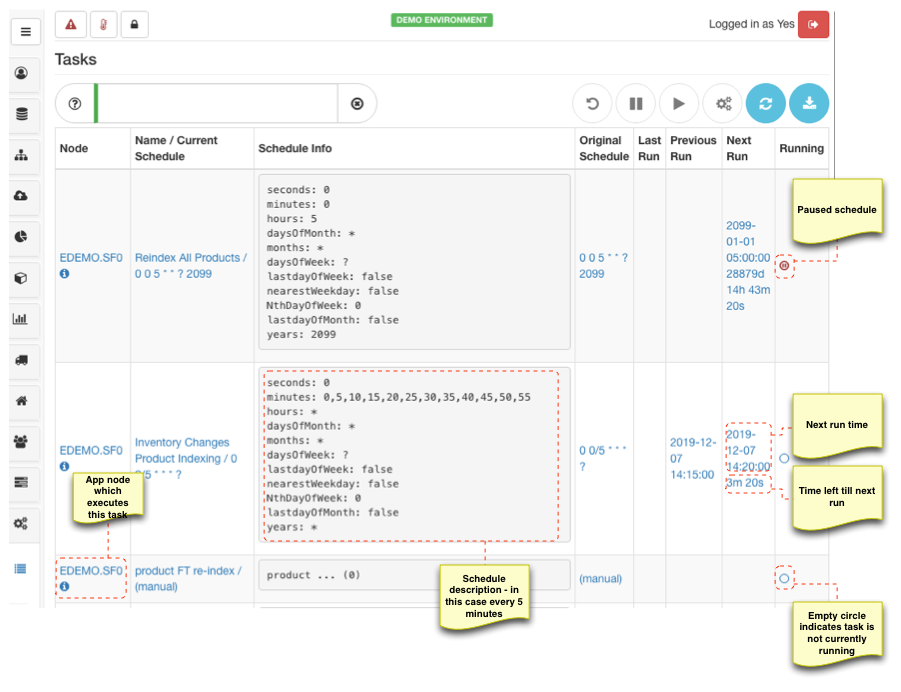
The platform has several asynchronous recurring processes in order to maintain its functions such as order state machine, price calculations, data maintenance, email processing etc. All schedules are declared in config-cronjob.properties which set the default rhythm for the platform, however in most production systems this rhythm requires some orchestration in many cases real time. SaaS offers a dedicated monitoring panel where all services on all nodes can be monitored, paused, triggered manually and re-scheduled at runtime.
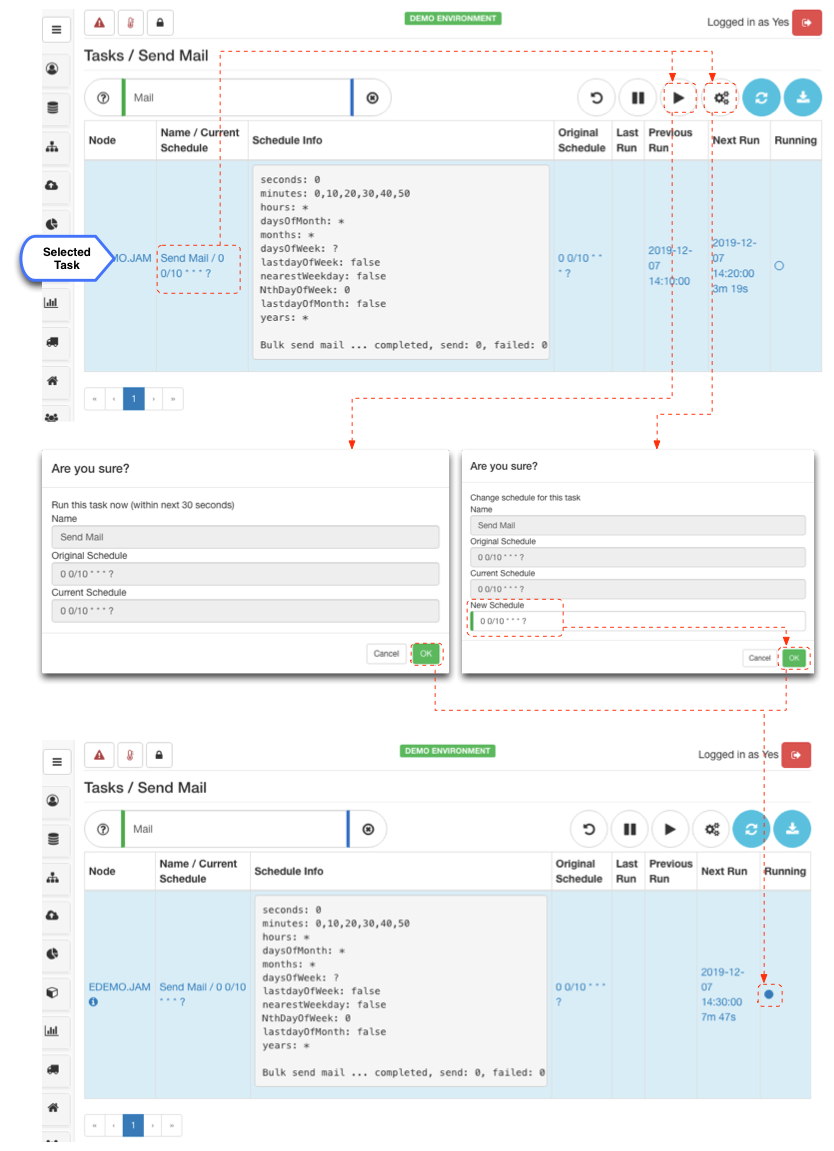
Managing task schedules can be accomplished in three distinct actions:
- Run task now - platform automatically calculates a one-off schedule to run task in 30seconds, after task has run manually it will become unscheduled and not run anymore
- Restore schedule - platform automatically will use the original schedule to from properties file
- Reschedule - user is invited to change the cron expression to instruct the platform to perform task at a different schedule
Storefront component rendering diagnostics SaaS
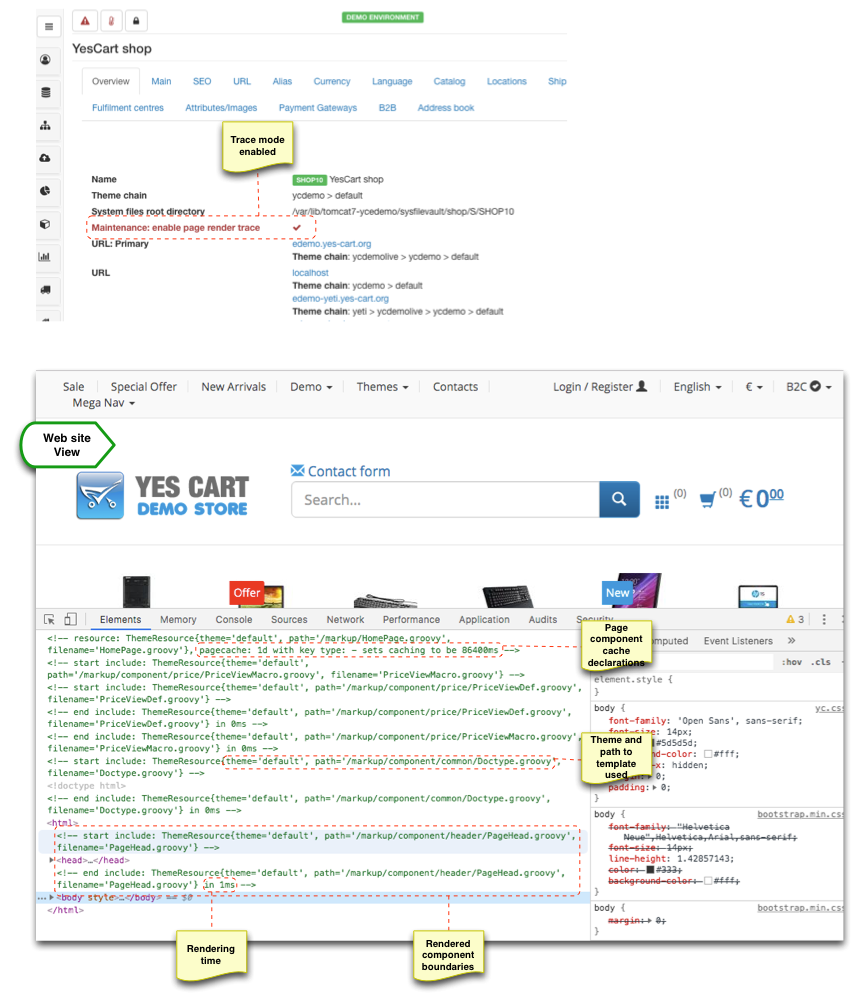
Storefront themes multiplied by complexities of CMS further obscured by vast variety of data and caching sometimes results in questioning why page rendering has been done in a certain way? or why some components are not present on the page? or are present but should not be?
SFG SaaS frontend application contains a setting to produce verbose output during page rendering. In order to enable this mode set shop attribute: Maintenance: enable page render trace. This attribute can also be observed on the Overview tab. When enabled detailed information will be printed out during rendering including:
- Full path of the components rendered in the page
- CMS elements included in the page
- Rendering times
- Caching information
Cluster
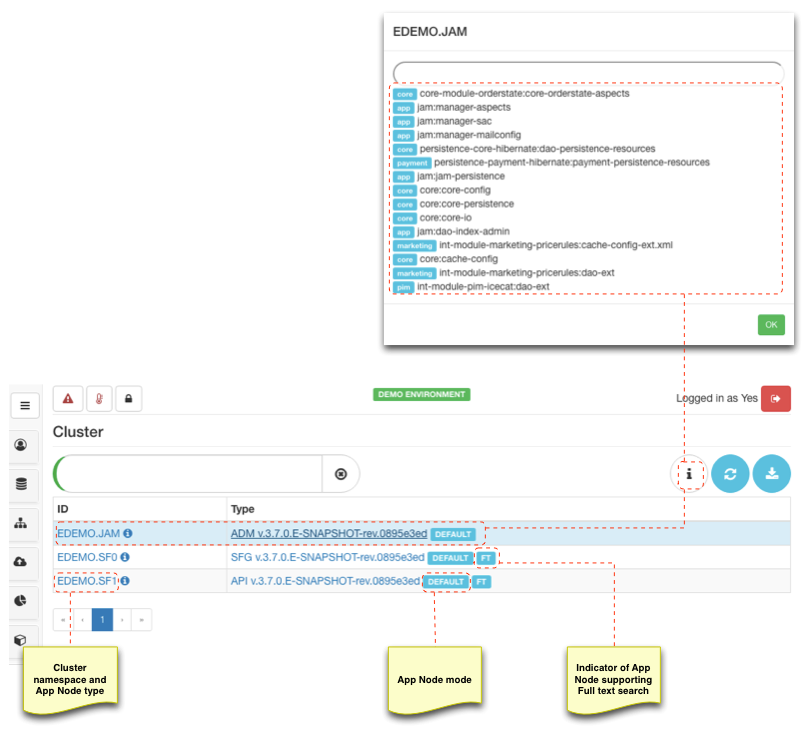
Cluster defines a network of applications (nodes). Cluster is either preconfigured or nodes are auto-discovered depending on the discovery module used (either WebService, REST or JGroups multicast connector).
Each node declares cluster namespace it belongs to, type (ADM, API or SFx), mode of operation and whether it uses full text search module. Along with this information cluster service can query each node to give full details of the build (i.e. all modules that are currently loaded).
Overview provided by cluster monitoring is vital in understanding platform infrastructure and composition of individual applications.
Application logs
All platform applications use Logback over SLF4j configuration. Capabilities of Logback a beyond the scope of this discussion and we highly recommend reviewing logback official documentation if you are not familiar with this framework.
Shop specific logging
For multi-tenant setups it is recommended to sift logs by shop discriminator. Platform provides several flavours of ready to use implementations:
ShopCodeLogDiscriminator
Uses current shop context to set shopCode variable, which produces value such as "SHOP10". This value can be used in file names to direct message of specific shop into a separate file.
  <appender name="SHOPPAY" class="ch.qos.logback.classic.sift.SiftingAppender">
       <!-- declare discriminator -->
       <discriminator class="org.yes.cart.utils.log.ShopCodeLogDiscriminator"/>
       <sift>
           <!-- shopCode can be use in appender name (e.g. view in JMX) -->
           <appender name="SHOPPAY-${shopCode}" class="ch.qos.logback.core.rolling.RollingFileAppender">
               <!-- shopCode can be use in file name -->
               <File>${catalina.base}/logs/yc-${shopCode}-pay.log</File>
               <Append>true</Append>
               <encoder>
                   <pattern>%d{yyyy-MM-dd HH:mm:ss.SSS} %5p %c{1}:%L - %m%n</pattern>
               </encoder>
               <rollingPolicy class="ch.qos.logback.core.rolling.FixedWindowRollingPolicy">
                   <maxIndex>10</maxIndex>
                   <FileNamePattern>${catalina.base}/logs/yc-${shopCode}-pay.log.%i.zip</FileNamePattern>
               </rollingPolicy>
               <triggeringPolicy class="ch.qos.logback.core.rolling.SizeBasedTriggeringPolicy">
                   <MaxFileSize>10MB</MaxFileSize>
               </triggeringPolicy>
           </appender>
       </sift>
   </appender>
ShopCodeAndLevelLogDiscriminator
Uses current shop context + log message level to set shopCode variable, which produces value such as "SHOP10-WARN". This value can be used in file names to direct message of specific level of specific shop into a separate file
 <appender name="DEFAULT" class="ch.qos.logback.classic.sift.SiftingAppender">
       <!-- declare discriminator -->
       <discriminator class="org.yes.cart.utils.log.ShopCodeAndLevelLogDiscriminator"/>
       <sift>
           <!-- shopCode can be use in appender name (e.g. view in JMX) -->
           <appender name="DEFAULT-${shopCode}" class="ch.qos.logback.core.rolling.RollingFileAppender">
               <!-- shopCode can be use in file name -->
               <File>${catalina.base}/logs/yc-${shopCode}.log</File>
               <Append>true</Append>
               <encoder>
                   <pattern>%d{yyyy-MM-dd HH:mm:ss.SSS} %5p %c{1}:%L - %m%n</pattern>
               </encoder>
               <rollingPolicy class="ch.qos.logback.core.rolling.FixedWindowRollingPolicy">
                   <maxIndex>10</maxIndex>
                   <FileNamePattern>${catalina.base}/logs/yc-${shopCode}.log.%i.zip</FileNamePattern>
               </rollingPolicy>
               <triggeringPolicy class="ch.qos.logback.core.rolling.SizeBasedTriggeringPolicy">
                   <MaxFileSize>10MB</MaxFileSize>
               </triggeringPolicy>
           </appender>
       </sift>
   </appender>
Out of the box logs
| Log file(s) | Sift | Level | Purpose |
|---|---|---|---|
| Storefront (API, SFx) | |||
| yc-${shopCode}.log | shop code + level | INFO | DEFAULT-${shopCode} appender (root) |
| yc-${shopCode}-pay.log | shop code | DEBUG | SHOPPAY appender, payment gateway related logging, packages:
|
| yc-orderexport.log | INFO | ORDEREXPORT appender, order export related logging, packages:
| |
| yc-orderstate.log | INFO | ORDERSTATE appender, order transition related logging, packages:
| |
| yc-mail.log | INFO | MAIL appender, email generation and send logging, packages:
| |
| yc-maildump.log | INFO | MAILDUMP appender, log full content of email that was sent | |
| yc-audit.csv | INFO | AUDIT appender, log persistence updates audit records | |
| yc-${shopCode}-ftq.log | shop code | INFO | FTQ-${shopCode} appender, logs all full text queries |
| yc-ws.log | ERROR | WS appender, logs web services communication (WS.IN and WS.OUT) | |
| yc-config.log | INFO | CONFIG appender, logs information on loaded modules and extension points | |
| yc-${shopCode}-sac.log | shop code | DEBUG | SAC (Security access control) appender, logs access violations |
| Admin (ADM) | |||
| yc-${shopCode}.log | shop code + level | INFO | DEFAULT-${shopCode} appender (root) |
| yc-${shopCode}-pay.log | shop code | DEBUG | SHOPPAY appender, payment gateway related logging, packages:
|
| yc-${shopCode}-job.log | shop code + level | INFO | JOB-${shopCode} appender, logs all tasks executions, packages:
|
| yc-${shopCode}-import.log | shop code + level | INFO | BULKIMPORT-${shopCode} appender, logs all data imports, packages:
|
| yc-remote.log | INFO | REMOTE (file upload/download/move/delete operations) appender, logs all data imports, packages:
| |
| yc-orderexport.log | INFO | ORDEREXPORT appender, order export related logging, packages:
| |
| yc-orderstate.log | INFO | ORDERSTATE appender, order transition related logging, packages:
| |
| yc-mail.log | INFO | MAIL appender, email generation and send logging, packages:
| |
| yc-maildump.log | INFO | MAILDUMP appender, log full content of email that was sent | |
| yc-audit.csv | INFO | AUDIT appender, log persistence updates audit records | |
| yc-ws.log | ERROR | WS appender, logs web services communication (WS.IN and WS.OUT) | |
| yc-config.log | INFO | CONFIG appender, logs information on loaded modules and extension points | |
| yc-${shopCode}-sac.log | shop code | DEBUG | SAC (Security access control) appender, logs access violations |
| yc-security.log | INFO | SECURITY (Spring) appender, packages:
|
