Performance test overview
This is performance review for version 3.0.0 of e-commerce platform based on demo store, which is shipped with the code base.
The performance test is based on the worst case scenario in terms of heaviest load by assuming conversion rate of 10% as most resource contingency is on the database level and hence - ordering process. This is more than enough to test most successful sites as "good" conversion rate is considered to be 3-5%. This setup allows to see how the system behaves when 90% of customers are browsing the site (Browsing Scenario or BS), whilst 10% of users are engaged in full ordering process (Checkout Scenario or CS) which encompasses adding to cart, registration and a complete checkout procedure.
BS will provide insight into caching and full text searching mechanisms, whist CS will concentrate on direct database operations related to ordering functions. Separating test into two scenarios running in parallel also allows to see clearly performance relating to each distinct customer activity, namely: researching and purchasing. This provides the reader with a clear picture of average response times (ART) for these activities and allow to make reasonable approximations with respect to actual conversion rates of their specific company.
The test is split into several levels through number of concurrent users allowed in the test (Concurrent users = number users using the site at the same time). There are four levels: 100, 500, 1000 and 2000. Each of these levels represents size of the online store.
| Sample | Browsing users | Checkout users | Benchmark |
|---|---|---|---|
| 100 | 90 | 10 ordering | a popular boutique |
| 500 | 450 | 50 ordering | a busy retailer with vast range of brands |
| 1000 | 900 | 100 ordering | nationwide well established superstores |
| 2000 | 1800 | 200 ordering | multinational enterprise level companies |
All tests are performed using a single storefront node, which is the simplest, cheapest (in terms of hardware) and most straightforward installation (fully functional store in 3h from blank operating system). The reason for this is that we wanted to show the potential of the system which allows fantastic level of throughput using minimal resources. Of course clustered environments will enjoy even better performance levels, however require more resource intensive infrastructure setup.
To give perspective to the figures we set the following real world benchmarks to browsing (page views per hour or p/h) and checkout (orders per hour or o/h). Typical retailers or well-known brands stores have demand for throughput of up to 70,000 p/h and up to 500 o/h during normal operation and around one and a haft times these figures during heavy sales (such as seasonal holidays). Large nationwide popular stores have demand for throughput of up to 200,000 p/h and up to 1,500 o/h during normal operation and around twice these figures during heavy sales.
Results outlined in this performance test report prove that even with a single node e-commerce platform is able to satisfy even large scale projects.
Test configuration
Method
The performance was measured using two tools in conjunction: JMeter and VisualVM. The method was to launch JMeter test scripts and monitor throughput. While the script was running VisualVM was used to monitor the CPU and Memory usage.
Each script was fine-tuned to have user/repetitions ratio such that each test run was no less than 45min ensuring that cache evictions and garbage collections are fully taken into account. Furthermore steps concerning results page selection and product details page selection was performed using random number generators to ensure the diversity of browsing is taken into account.
Above stated method allowed to get insight into the application's performance as it would behave in a real world taking no shortcuts or simplifications - this is the real performance with no details hidden.
Test scenarios
Browsing (BS)
- View home page
- Perform a search that has no results
- Navigate to 'notebooks' page 5
- Filter results by price
- Sort products by name
- Filter results by brand name
- Sort by price descending and navigate to second page
- Perform a global search by keyword
- Perform a search by keyword in 'notebooks'
- Loop 5 times
- View products in 'notebooks' filtered by price on a random page
- Select random product from the page viewed
Checkout (CS)
- Loop 3 times
- View products in 'notebooks' filtered by price on a random page
- Select random product from the page viewed
- Add product to cart with quantity 1
- View cart page
- Increase quantity of one product (random line)
- Increase quantity of another product (random line)
- Complete Registration
- Create new shipping address
- Select carrier and shipping method
- Go to payment
- Complete payment
- Go to My Account
Resources
The following hardware and software was used during performance testing:
| Resource | Version/Spec | Notes |
|---|---|---|
| Processor | Intel Xeon E3-1230 3200MHz/L3-8192Kb/DMI s1155 | |
| RAM | 16GB DDR3 PC3-10600 1333MHz ECC (-Xms1024m -Xmx4096m) | Java memory allocation: -Xms1024m -Xmx4096m |
| HDD | 2x WD VelociRaptor WD1500ADFD 150Gb, RAID1 | |
| Java SDK | OpenJDK 1.8.x | |
| Tomcat | v.7.x.x | 1 instance, standalone non-native |
| Apache HTTP | | |
| RDBMS | MySQL v 5.5 | same machine typical non-tuned installation |
| Platform | 3.0.0 | basic single Demo store + YUM installation, file system based full text index |
Test results 3.x.x single node
Each test had run approximately 45min to ensure cache evictions and garbage collections are taken into account.
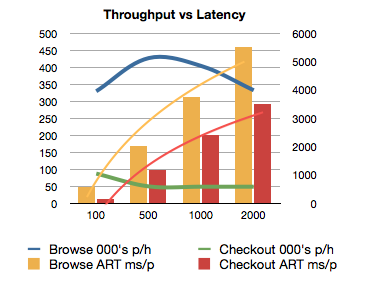
It is clear from figures below that order processing throughput per hour remained at a high level of 87,000 orders per hour for 100 users declining to 48,000 order per hour for 2,000 users. This metric proves the platform is capable of handling load even for large nationwide popular stores during peak sales (~3,000 o/h).
Looking at the page per hour figures we exhibit that the platform is more than capable to handle the browsing users as well. With 330,000 pages per hour for 100 users, simply because there is not enough users to get greater throughput, and 400,000+ pages per hour for 500 and 1,000 users, slightly declining to 330,000 for 2,000 users - it is clear that even large nationwide popular stores during peak sales (400,000 p/h) will enjoy great performance.
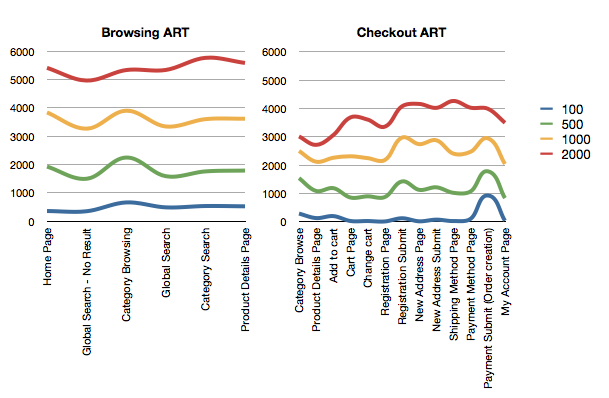
Figures suggest that even with heaviest load (2,000 users) full browsing, registration and checkout process with three items in the cart will take no more than 73 seconds.
| Metric | 100 | 500 | 1000 | 2000 |
|---|---|---|---|---|
| CPU consumption | 30-50% | 40-70% | 50-80% | 50-80% |
| Memory consumption | 500MB - 1GB | 1GB - 3GB | 1GB - 3.6GB | 1.5GB - 4GB |
| RDBMS connection pool | 2000 | 2000 | 2000 | 2000 |
| Throughput pages per hour (000's) | 330K | 425K | 404K | 330K |
| Number of pages browsed | 85,500 | 213,000 | 205,000 | 205,000 |
| Number of orders created | 500 | 1,250 | 1,200 | 1,200 |
| Order processing throughput per hour (000's) | ~87K | ~49K | ~48K | ~48K |
| End to end order processing time for three items and full registration | ~3,521ms | ~25,665ms | ~53,063ms | ~73,060ms |
| Checkout only order processing time for three items and full registration | ~1,610ms | ~14,172ms | ~32,381ms | ~49,648ms |
| Product List/ Search ART | ~572ms | ~2,200ms | ~3,600ms | ~5,511ms |
| Product Details ART | ~525ms | ~1,787ms | ~3,600ms | ~5,586ms |
| Add to cart ART | ~206ms | ~1,193ms | ~2,265ms | ~3,066ms |
| Cart ART | ~33ms | ~861ms | ~2,317ms | ~3,690ms |
| Checkout step 1 (registration) ART | ~147ms | ~2,309ms | ~4,359ms | ~7,442ms |
| Checkout step 2 (address) ART | ~93ms | ~2,354ms | ~5,627ms | ~8,191ms |
| Checkout step 3 (shipping) ART | ~62ms | ~2,054ms | ~4,825ms | ~8,540ms |
| Checkout step 4 (payment) ART | ~1,157ms | ~3,943ms | ~7,906ms | ~12,060ms |
| My Account ART | ~44ms | ~842ms | ~1,750ms | ~3,500ms |
ART - Average response time

